Introduction
Power BI has grown to be a popular option for businesses looking for a reliable business intelligence solution. To use the platform to its fullest potential, it’s crucial to comprehend the distinctions between Power BI Desktop and Power BI Service. In this post, we’ll examine the differences between Power BI Desktop and Power BI Service and how they work in tandem to produce reports and analyze data.
The Power of Power BI Desktop is in Your Hands.
A robust Windows program created by Microsoft as part of the Power BI suite is called Power BI Desktop. For designing, developing, and disseminating interactive reports and visualizations, it acts as a complete tool. Users of Power BI Desktop can connect to a variety of data sources, turn unstructured data into actionable insights, and produce visually arresting representations of the data.
Key Characteristics of Power BI Desktop
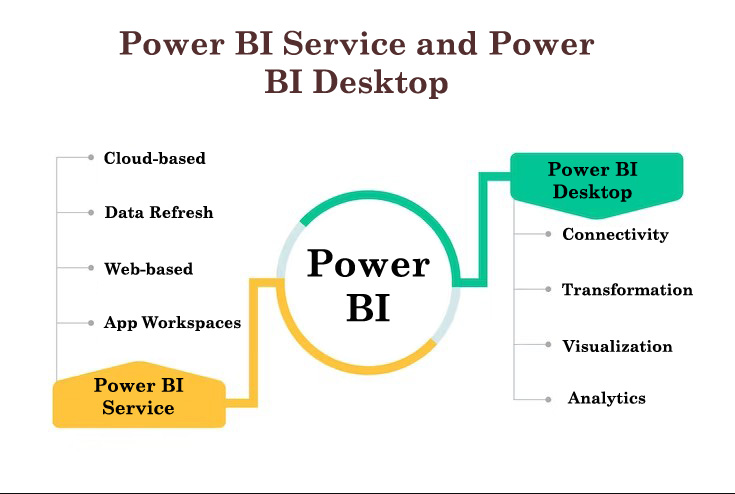
- Data Connectivity: Power BI Desktop offers a large selection of data connectors that let users connect to a variety of data sources, including databases, cloud services, Excel files, SharePoint lists, and more. Due to this interconnectedness, users can combine data from many sources for analysis and reporting.
- Data Transformation and Modelling: Through Power Query, Power BI Desktop offers data transformation features that let users organize, shape, and work with data. In addition, it supports Power Pivot’s extensive data modeling features, which let users construct relationships between tables, generate calculated columns and measures, and carry out intricate computations.
- Visualization and Reporting: Power BI Desktop provides a wide range of visualizations, such as charts, graphs, maps, tables, and custom visuals. These visualizations can be customized by users to properly depict data by dragging and dropping them into the canvas. Additionally, Power BI Desktop has a strong reporting environment that enables users to design pixel-perfect reports with complete control over formatting and layout.
- Advanced Analytics: Power BI Desktop has features for advanced analytics, including the incorporation of R and Python scripts. These scripting languages allow for the execution of intricate statistical analysis, predictive modeling, and data manipulations.
- Data Analysis Expressions (DAX) Formulas: Power BI Desktop supports DAX, a formula language that enables users to create calculated columns, measures, and tables. To execute computations and data aggregations, DAX offers strong functions and expressions.
- Publishing and Sharing: Power BI Desktop enables users to share their reports and visualizations with others by saving them as PBIX files or by publishing them to the Power BI Service. Users may collaborate, share, and access reports and dashboards using a web browser or mobile app from any location by publishing to the Power BI Service
- Local Processing: Power BI Desktop processes data locally on the user’s computer and executes calculations. This makes it possible to manipulate and analyze data more quickly, especially when working with enormous datasets.
- Report Authoring: Power BI Desktop offers a robust authoring environment that enables users to develop bespoke dashboards and produce pixel-perfect reports. The visual design, formatting, and interactivity of the reports are completely under the hands of the users.
Users may generate, design, and publish reports and visualizations locally on their desktop computers using the robust program Power BI Desktop. It offers sophisticated data modeling skills, tools for transforming data, and a variety of data visualizations.
Power BI Service: Cloud-based Insights and Collaboration
A web-based platform that works in conjunction with Power BI Desktop is called Power BI Service, commonly referred to as Power BI Online or Power BI Cloud. It provides sharing, collaboration, and other capabilities that improve the reporting and analysis process. Here are some of the main characteristics of Power BI Service:
- Cloud-based Collaboration: Power BI Service allows users to collaborate with colleagues inside their organization by allowing them to share reports, dashboards, and datasets. Enabling users to collaborate, co-author reports, and give comments in real-time, it encourages teamwork.
- Data Refresh and Scheduled Refresh: Users of the Power BI Service have the option to program automatic data refreshes for their dashboards and reports. By doing so, it is ensured that the data is current and accurately reflects any recent changes made to the underlying data sources.
- Web-based view: Users of Power BI Service can view reports and dashboards from any location and on any device by using a web browser. This adaptability enables easy data exploration and mobile decision-making.
- Collaboration and Sharing: The Power BI Service offers sharing features that let users manage who has access to reports and dashboards. Users can specify permissions to provide particular people or groups access at various levels
- App Workspaces: Teams can collaborate in app workspaces, which can be created using Power BI Service. These workspaces allow teams to work on shared datasets, reports, and dashboards. App workspaces facilitate knowledge exchange and distribution throughout organizations while fostering teamwork.
- Content Packs: The Power BI Service provides pre-built content packs that contain dashboards, reports, and datasets that are ready to use for well-known programs and services like Salesforce, Google Analytics, and Azure. By offering a place to begin an analysis, these content bundles hasten the deployment of analytics tools
Conclusion
The Power BI ecosystem’s two crucial components, Power BI Desktop and Power BI Service, each have a specific function. Users of Power BI Desktop may do advanced data analyses and create beautiful visualizations. On their local machines, they model and create customized reports and dashboards. The Power BI Service, on the other hand, makes it easier to collaborate, share, and access reports and dashboards over the cloud, fostering teamwork and ensuring that decision-makers have access to real-time information. Organizations may make use of the benefits of each component by comprehending the differences between Power BI Desktop and Power BI Service. Businesses can maximize their data analysis and reporting capabilities, promoting informed decision-making and a data-driven culture by fusing the authoring and data modeling capabilities of Power BI Desktop with the collaboration and sharing features of Power BI Service.
